Drupal Reports and Statistics Tutorial
How to view and manage reports and statistics in Drupal
Drupal has a report system that can help you manage your site and provide you with information about everything that's going on on your site. There are different reports that inform you about such things as the available updates for your core Drupal modules, contributed modules, themes, etc. You can view information concerning your Drupal hosting account (e.g. PHP and database related information, etc.). You can check the log for errors and actions that have been performed on the site. You can check the top search phrases and do many other things. In addition to these reports you can also enable the core Statistics module which will provide you with more information.
To view all the reports, log in to the admin panel of your Drupal and click on the Reports tab in the top navigation bar. On the page that opens you'll see a list of buttons for all the default reports that are enabled with the standard Drupal installation profile:
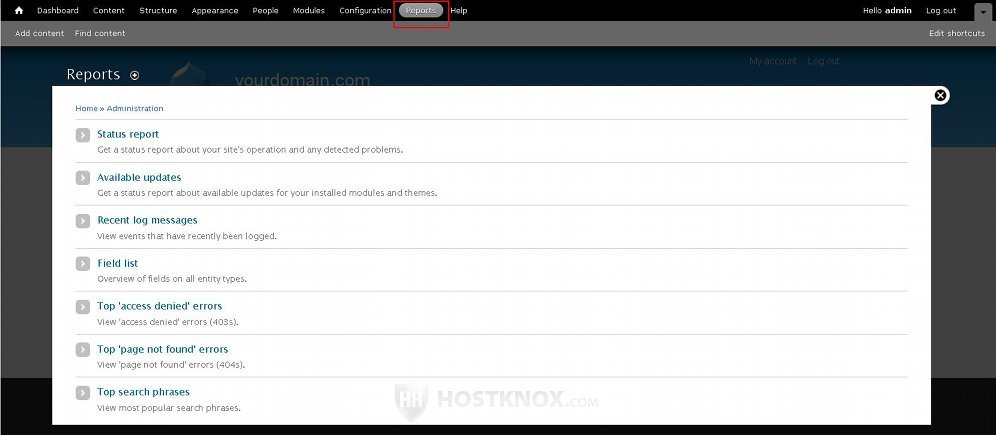
The default available reports are Status report, Available updates, Recent log messages, Field list, Top 'access denied' errors, Top 'page not found' errors, and Top search phrases.
The Status report will show you general information about your Drupal application and Drupal hosting account. You can see the version of your Drupal and whether it's up to date, as well as whether the core modules are up to date. You can see the database system (MySQL) and its version, and the PHP version and some other PHP related information.
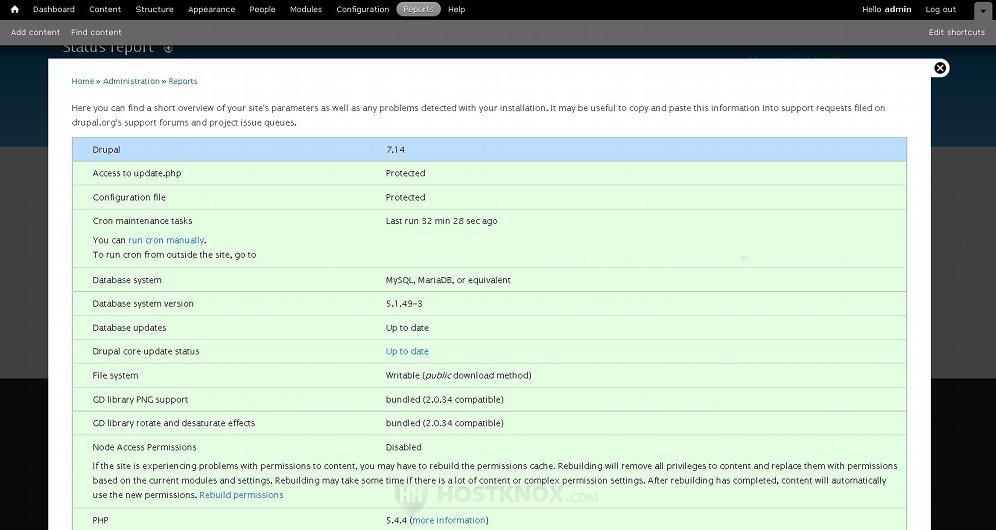
You can do a few things on this page. You can run a cron job manually by either clicking on the run cron manually button or on the URL link that's provided. The cron job will check for new updates and will index the site. You can rebuild the node access permissions by clicking on the Rebuild permissions link. You can use this options if there are problems with accessing the content on your site. You can also view the full PHP information by clicking on the more information link that's next to the PHP version number.
The Available updates report will list all the Drupal core modules and themes, as well as third party modules and themes (if you have installed any), and it will show whether they're up to date and whether there are any updates available. By default, Drupal checks automatically for new updates; you can check manually by clicking on the Check manually button:
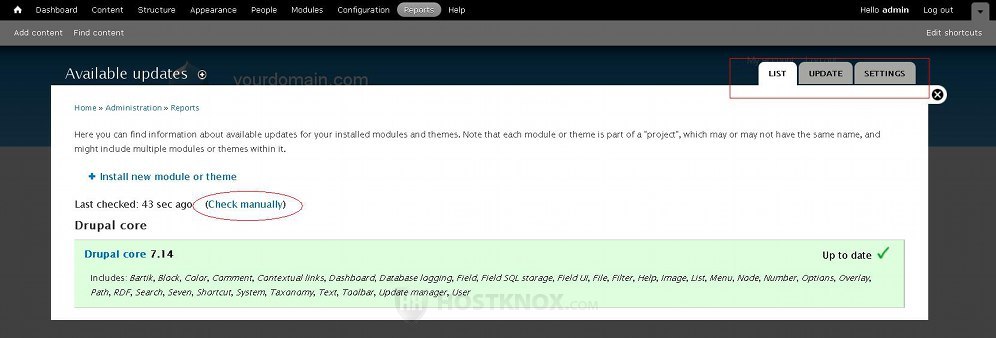
At the top right corner of the page there are three tabs: List, Update and Settings. When you open the Available updates report the List page is displayed by default. You can use the Update tab to update your modules and themes, and the Settings tab will show you some update options:
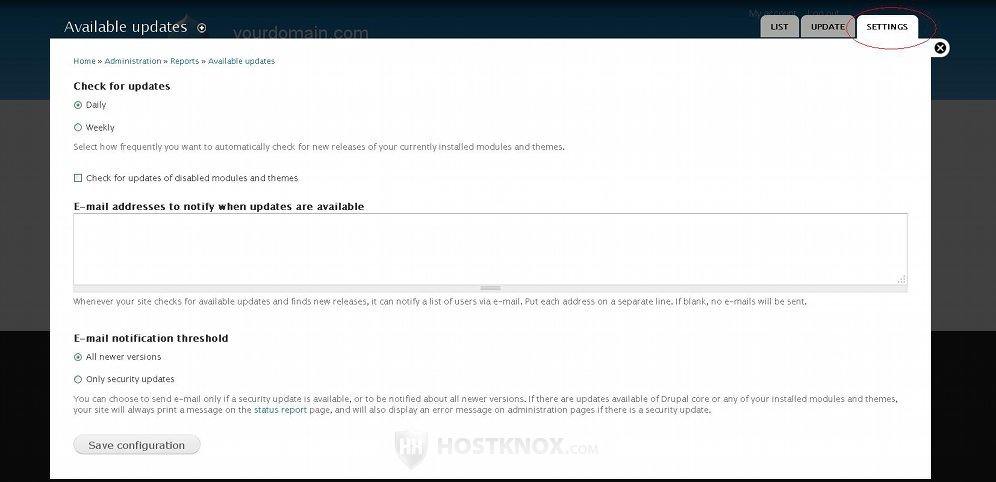
You can change how often Drupal should check for new releases of the modules and themes that you have installed. By default, it's configured to check daily. You can also enable the setting for checking for updates of disabled modules; just mark the checkbox for Check for updates of disabled modules and themes. In the text area that's provided you can specify an email(s) for receiving notifications when there are new updates. You can specify more than one email; simply type each email on a new line. When Drupal checks for updates and finds new releases, the listed emails will be notified. The last setting allows you to specify whether email notifications should be sent for any available update or only for security updates. If you make any changes don't forget to click on the Save configuration button at the bottom of the page.
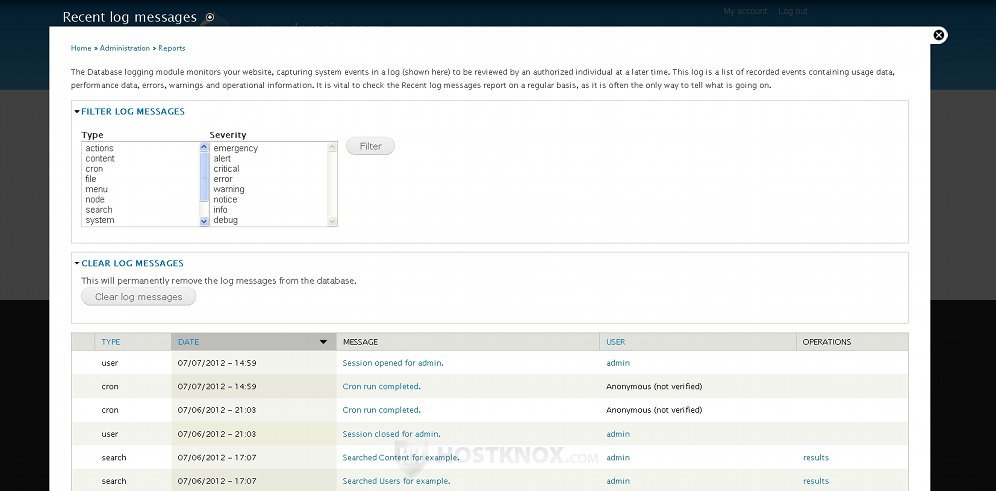
You can use the Recent log messages report to check for various things. This function is provided by the core Database logging module. On the Recent log messages page you'll see a table listing errors and system events such as cron runs, users logging in and out, content changes, etc. There can be many pages with log messages. You can filter them according to certain criteria. Click on the Filter Log Messages button to see the filtering options. You can filter the messages according to the type of message (e.g. action, content, cron, etc.), and/or according to the severity of the message. You can also clear all the log messages. To do this click on the Clear log messages button that's above the table listing the messages:
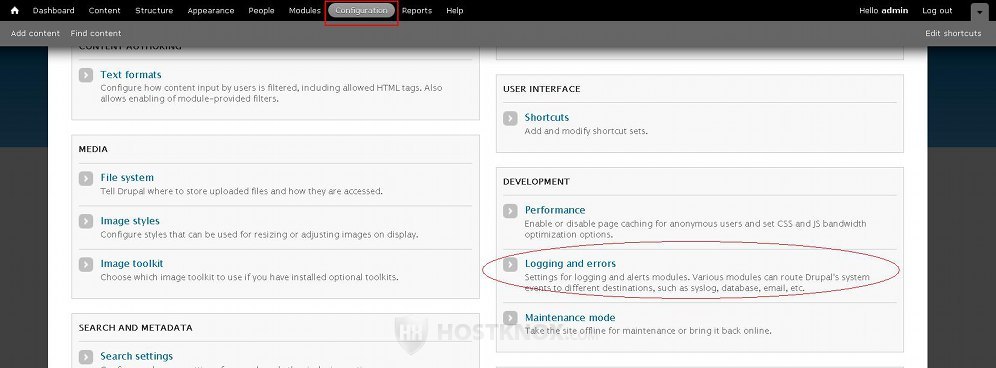
The log messages are kept in the database. You can set the maximum number of log messages to be kept in the database. To do this click on the Configuration tab of your Drupal admin panel's top navigation bar, and on the page that opens click on Logging and errors:
On the page that opens use the drop-down menu labeled Database log messages to set the maximum number of messages to be saved in the database. By default, it's set to one thousand:
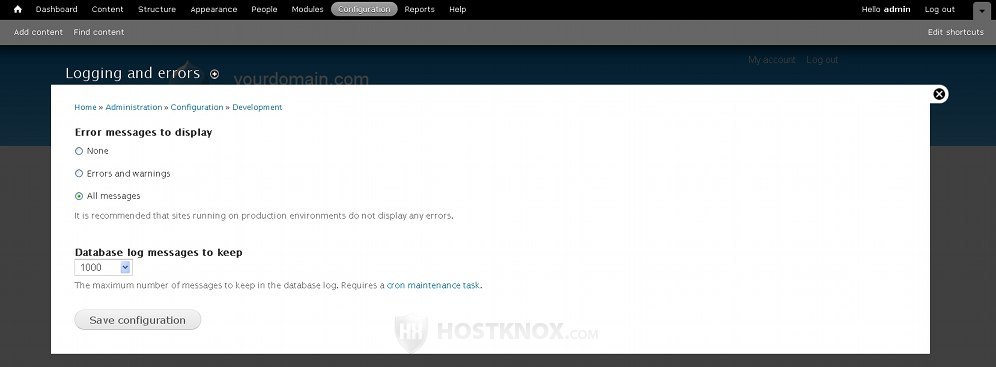
On the same page there's also an option to select which messages are to be displayed. If you make changes don't forget to click on the Save configuration button.
Back to the reports, the next default report is Field list:
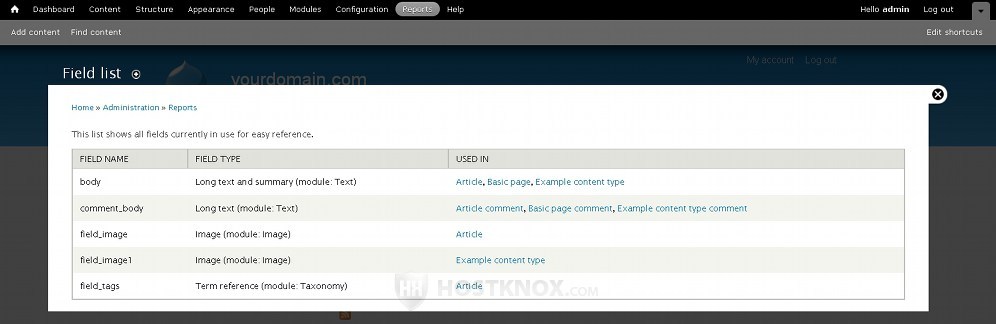
It lists all the content, taxonomy and user fields. Both the preconfigured fields that come with every Drupal installation are listed and the ones that you have created. In the table each field is listed with its machine name as it exists in the database, not with its label. The field type is also listed, and in the Used in column are listed all the places in which the particular field appears; you can click on the links in that column to go to the Manage Fields page of the particular content type, taxonomy, etc. For more information on fields check out the tutorial on managing fields in Drupal.
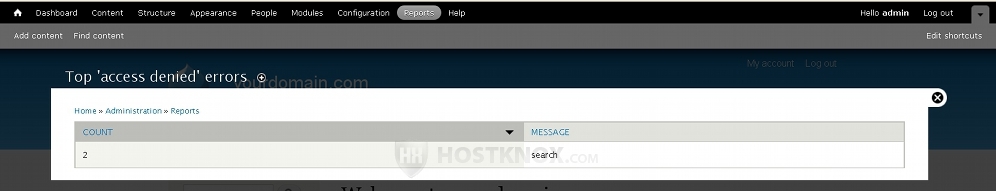
The report Top 'access denied' errors, as the name suggest, lists all the pages that users have tried to open but couldn't because the user role they're assigned to doesn't have the necessary permission to open the particular page (or perform the specific action). For example, anonymous users/visitors don't have the permission to use the search function by default. So if a visitor tries to open the search page (e.g. yourdomain.com/search), they will be denied access to that page. On the Top 'access denied' errors page you'll see listed in the table the number of times people attempted to view the page (in the Count column), and the path to the page (in the Message column):
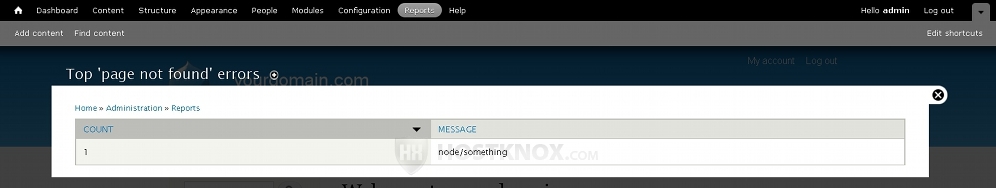
The next report is Top 'page not found' errors. It displays a list of the pages that users have tried to open but the particular pages just don't exist on your site. For example, your Drupal site is accessible at yourdomain.com and somebody tries to go to the URL address yourdomain.com/node/something. However, this page does not exist on your site and so it will be listed in the report:
The last of the default reports is Top search phrases. It shows the phrases and words for which users have searched on your site:
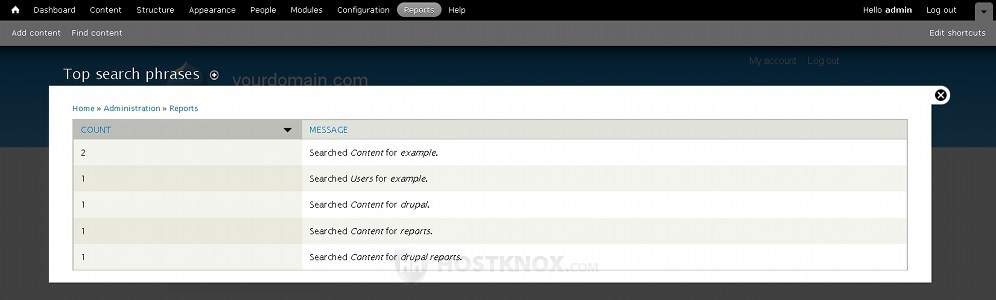
In the Count column you'll see the number of times users have searched for the particular word or phrases, and in the Message column you'll see the word or phrase itself, as well as whether the content or users have been searched through for the particular phrase. For more information on how searches are performed in Drupal and on how to configure the search settings check out the tutorial on managing the search function in Drupal.
Statistics
Drupal comes prepackaged with a Statistics module which, however, is disabled by default. To enable it, click on the Modules tab in the top navigation bar of your Drupal's admin panel. On the page that opens find the Statistics module, mark its checkbox and click on the Save configuration button at the bottom of the page.
This will automatically add four more reports. They are labeled Recent hits, Top referrers, Top pages and Top visitors:
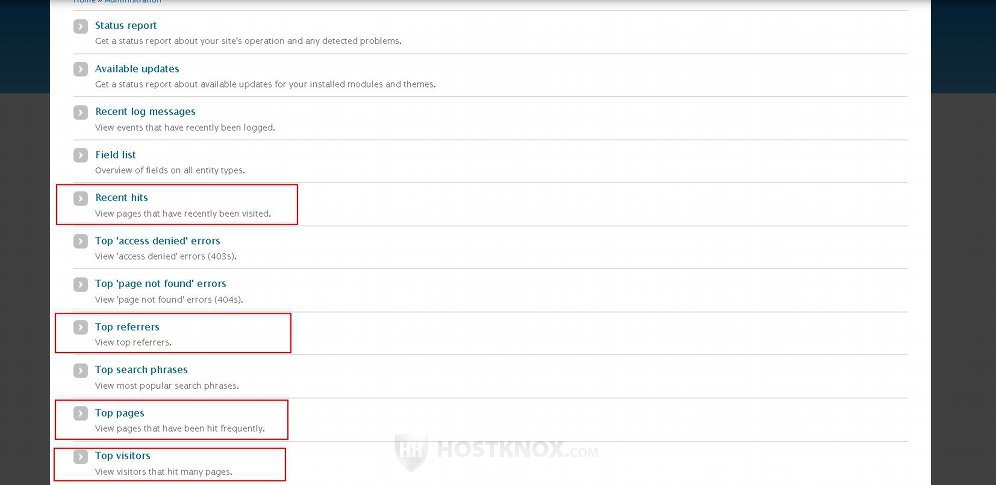
These reports will show you who visits your site the most, which external sites they come from, which pages on your site are the most popular ones, etc.
The Recent hits report will show you a table with the most recent visits to your site. It will display each page that was visited, the date and time of the hit, and the user (anonymous or registered) who visited the page. For each hit there's a details button in the table. When you click on it you'll also be able to see the full URL address of the visited page, the referrer (the URL which the visitor came from), and the IP address of the visitor.
The Top referrers report will display the top external URLs from which visitors came to your site.
The Top pages report will show you the most popular and frequently visited pages on your site. It will show you how many times the particular page was visited, the average page generation time, and the total page generation time.
The Top visitors report lists the users who have visited the pages on your site the most. If the user is a registered one, their username will be listed. If the user is anonymous, their IP will be shown instead. For each user, you'll also see the number of times (hits) that the user has visited the pages on your site and the total page generation time of all the pages the user has visited. For each anonymous user there's also a block IP address button. You can use it if you want to ban the user (or bot) from your site.
Note that in order for the above four reports added by the Statistics module to be active you need to enable the access log setting. To do this click on the Configuration tab in the top navigation bar and on the page that opens click on Statistics (it's in the System section). On the next page mark the checkbox labeled Enable access log:
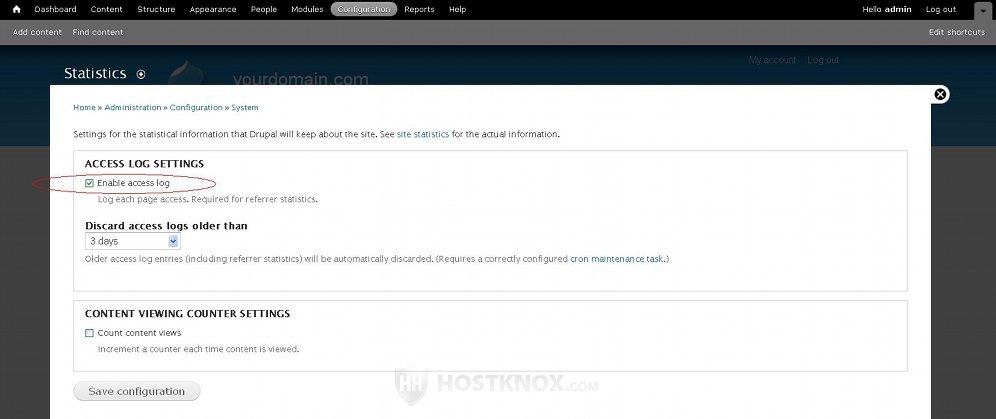
On the page with the statistics settings there are also a couple of other options. From the drop-down menu Discard access logs older than you can choose for how long the statistical information should be kept in the database. By default, it's set to three days. This applies only to the four reports added by the Statistics module, not to the other reports.
If you mark the checkbox for Count content views, a counter will be added to each content item (node) on the frontend of the site. It's displayed both in the teaser and full view in the bottom right corner of the node (e.g. 2 reads, 3 reads, etc.). By default, the counter is displayed only to administrators. If you want users belonging to any other role to be able to see the counter, you have to give the necessary permission. To do this, in your Drupal admin panel go to People tab>Permissions sub-tab, then scroll down the page to the Statistics section and enable the permission View content hits for the desired user role. Enabling the Count content views option will also add a preconfigured Popular content block. The block, however, is disabled by default. You can enable it so that it's displayed on the frontend, and you can edit its settings so that it shows links to the most popular nodes for the day, for all time and the most recently viewed ones.
For more information on how to configure and enable/disable blocks read the Drupal blocks tutorial.
Tracker
Drupal comes with a Tracker module which is also disabled by default. This module is used to view the most recently created and edited content; it also allows you to track the content that other users have published. Unlike the Statistics module, enabling the Tracker module won't add any settings or report pages to the admin panel. You can view the newly added and edited content by opening the Recent content page on the frontend. If your site is accessible at yourdomain.com, the URL address to the page would be yourdomain.com/tracker. If the text of a node has been edited or new comments have been added, it will be listed on the Recent content page. In the table on that page you'll see the title of the node, its content type, the author, the number of comments and when it was last edited.